Plot Junctions
A MATLAB tool that generates band diagrams of semiconductor junctions
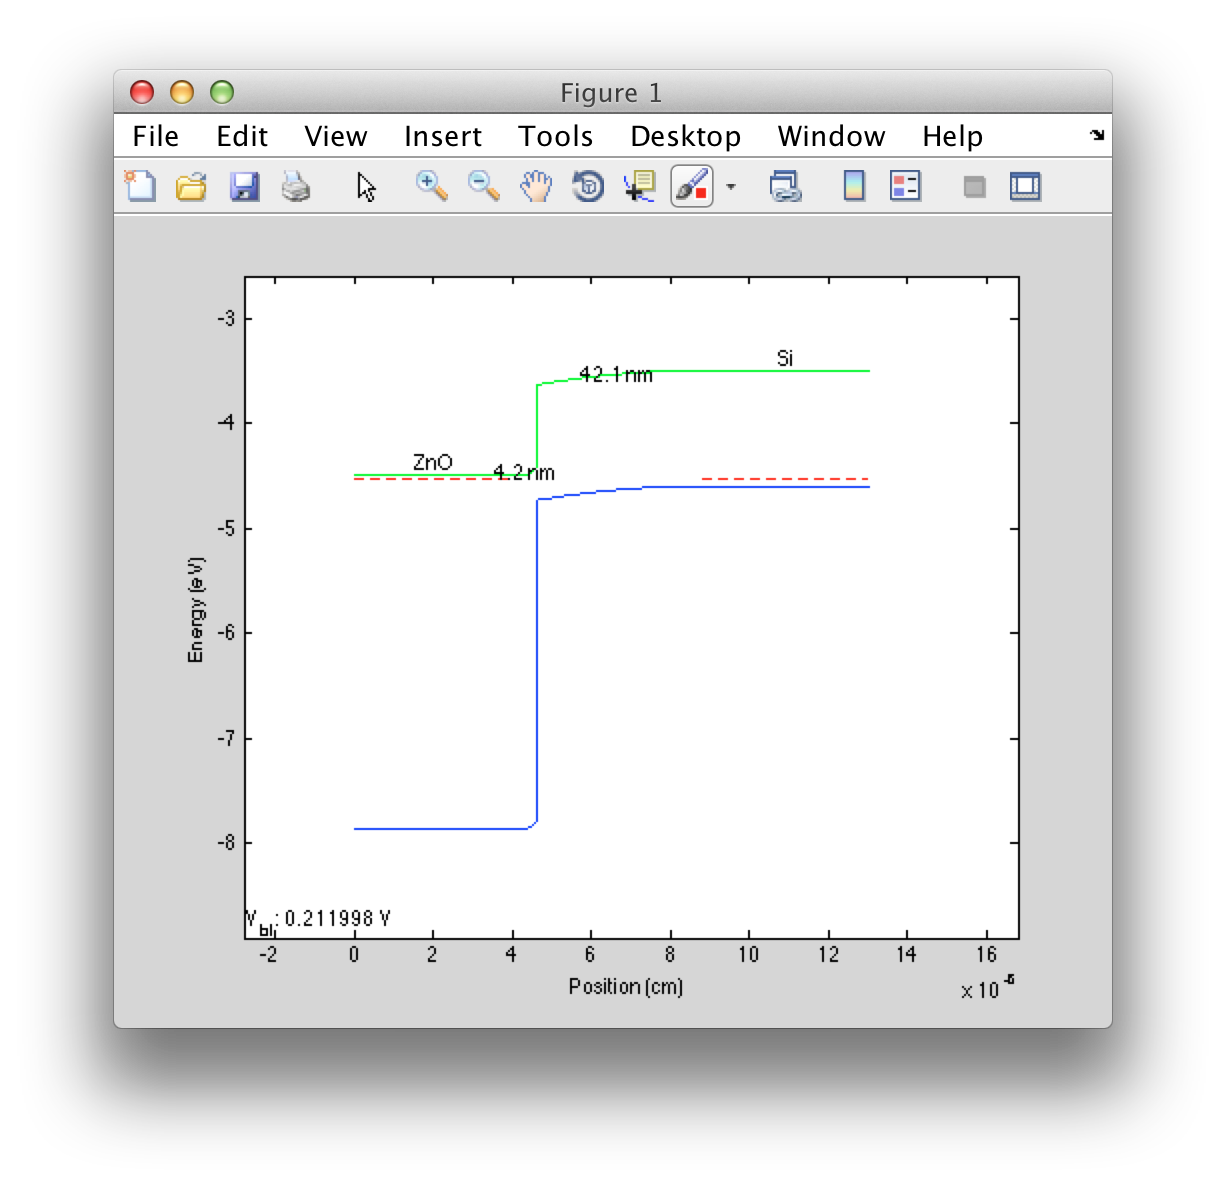
When designing solar devices, testing large sets of materials is costly because a batch of test devices must be fabricated for each combination of materials. Plot Junctions makes it very easy for chemists to generate band diagrams by automating the time-consuming calculations. It even has a library with material constants for common materials.
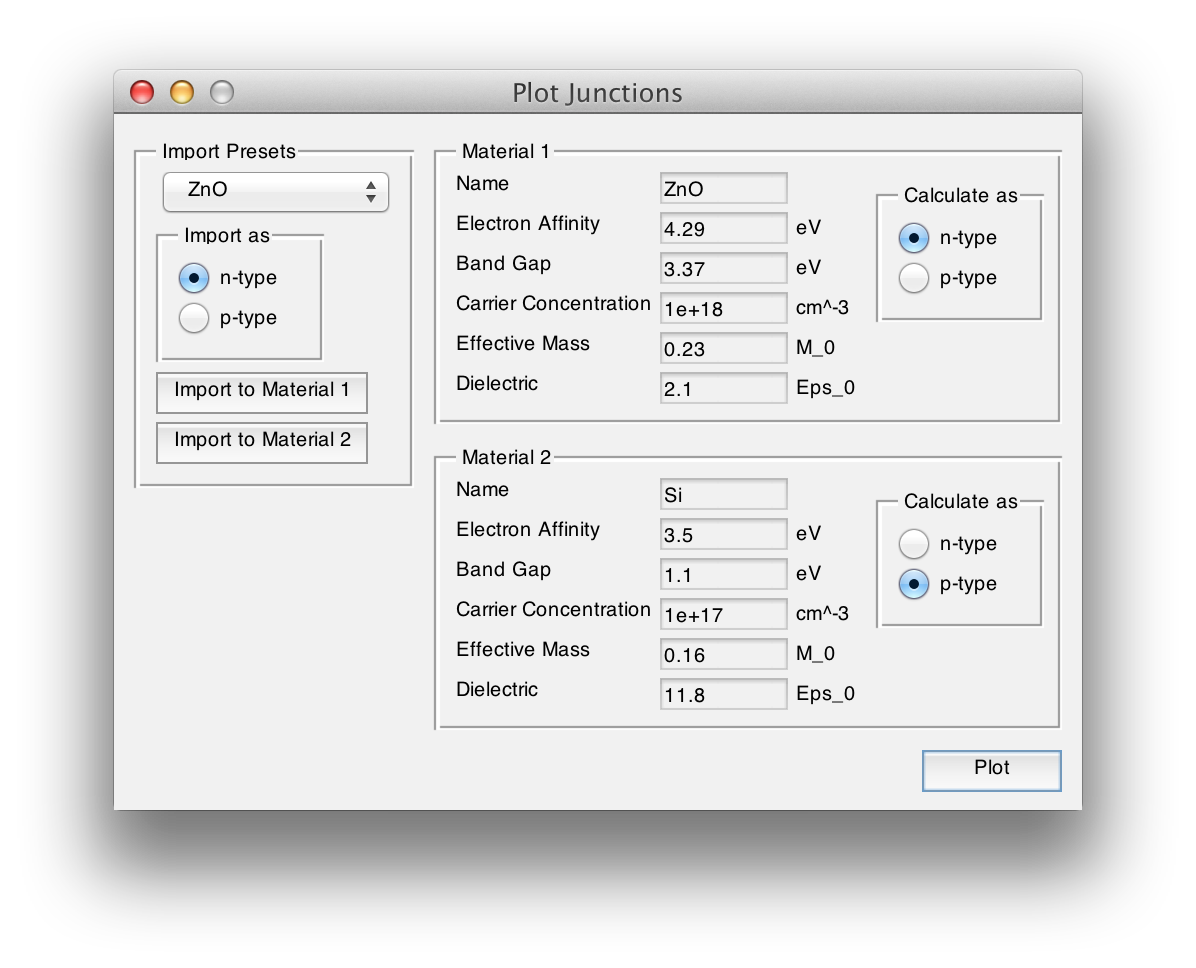
Plot Junctions can be split roughly into a frontend and a backend. The frontend is the plotjunctions_gui(): it manages the user interface and receives input from the user. The frontend then takes the user’s input and hands it off to the backend, which is a loosely coupled set of classes that collectively carry out all of the program’s responsibilities. This modular design allows flexibility and makes future expansion easy: to add support for a new material or junction type, just write a new class that conforms to the spec.